Strong Signal, Slow Data: Where the Real Bottlenecks Hide

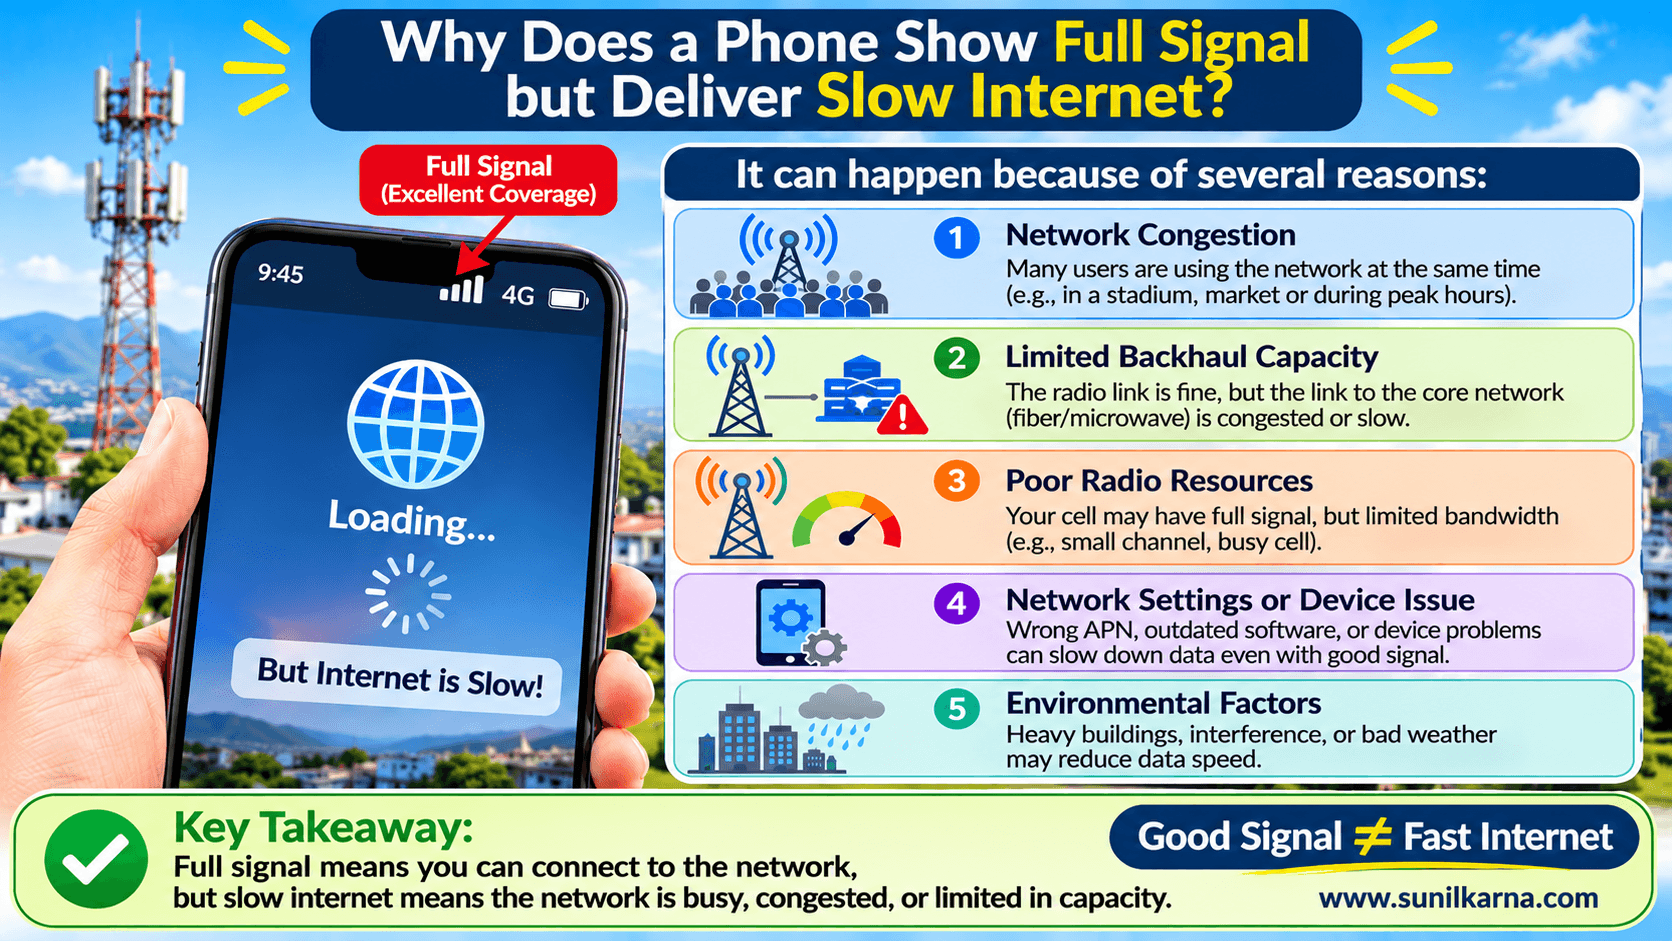
The Complaint Every Operator Knows
A subscriber stands in the middle of a city. Their phone shows full bars. They open a video and it buffers. They call customer care and say: "Your signal is full, but your internet is dead."
The engineer checks the site. The tower is alive, alarms are clear, and coverage maps are green. Yet the customer is right, and so is the engineer.
This apparent contradiction exists because the signal bars were never designed to measure internet speed. By the end of this article, you will know exactly what they measure, what they miss, and where the real bottlenecks hide. You will also see why this matters for network planning, quality-of-service regulation, and national broadband policy.
1. What the Bars Actually Tell You
The bars on a phone are a simplified display of received signal strength. In LTE and 5G NR, the underlying measurement is RSRP (Reference Signal Received Power): the average power of the cell's reference signals, the known "pilot" signals the tower broadcasts continuously so phones can find and measure it.
Think of RSRP as how loudly you can hear a speaker in a room.
Here is the catch: loudness says nothing about how much the speaker is able to tell you. Speed depends on how clearly you can hear, how many others are asking questions, and how much information the speaker can deliver per second.
Bars answer one question: "Can I hear the tower (BTS/NodeB/eNodeB/gNodeB)?"
Users are asking a different one: "Can the network carry my data quickly?"
The rest of this article explains the gap between those two questions, one layer at a time.
2. Loud Is Not Clear: Signal Quality (SINR, RSRQ, CQI)
The concept
In a crowded room, a strong voice is useless if ten other people are shouting at the same moment. Radio works the same way.
SINR (Signal-to-Interference-plus-Noise Ratio): the ratio of useful signal power to the sum of interference from other cells and background noise. Measured in dB.
RSRQ (Reference Signal Received Quality): a normalized quality measure combining RSRP with total received power, so it falls when interference or loading rises.
CQI (Channel Quality Indicator): a value (0–15) the phone reports to the tower, essentially saying "this is how good my channel is, please choose your transmission format accordingly."
Why it limits speed
The tower uses the phone's CQI to select the MCS (Modulation and Coding Scheme), which sets how many bits each radio symbol carries.
Channel condition | Typical modulation | Bits per symbol |
|---|---|---|
Poor SINR | QPSK | 2 |
Moderate SINR | 16-QAM | 4 |
Good SINR | 64-QAM | 6 |
Excellent SINR | 256-QAM | 8 |
A phone with full bars but poor SINR may be locked at QPSK, so it gets a quarter of the bits per symbol of a phone with excellent SINR, on the same tower, with the same bandwidth.
Where poor SINR comes from
Overlapping cells in dense urban areas, especially with a tight frequency reuse (reuse-1) design.
Pilot pollution: many strong cells heard at once, none dominant. The phone sees several strong signals but cannot cleanly follow any one.
Overshooting sites: a tower on a hilltop or high rooftop that spills signal into areas it was never planned for.
Poorly tuned tilts and azimuths after rollout, swaps or expansions.
Takeaway: a high-RSRP, low-SINR location is a planning and optimization problem, not a coverage problem. Adding more power makes it worse.
3. The Shared Road: Cell Congestion
The concept
A cell is a shared resource. The scheduler divides its capacity among all active users; the base station algorithm decides, millisecond by millisecond, which user gets which radio resources.
The basic unit of that sharing is the PRB (Physical Resource Block), a slice of spectrum and time. A cell with a fixed number of PRBs per millisecond must split them among everyone who has data to send.
What happens at busy hour
Imagine a four-lane highway. At 3 AM, one car cruises freely; at 7 PM, 100 cars share the same road. The road is the same, the road signs are equally visible, but each car crawls.
At peak hours, in markets, stations, campuses, religious gatherings or events, PRB utilization approaches 100%. Each user's slice of airtime shrinks, and so does throughput, while RSRP stays perfect.
Takeaway: Look at average user throughput and PRB utilization during busy hour, not just coverage. A cell with PRB utilization above roughly 70–80% at peak is typically entering a congestion zone, and user experience degrades well before the cell "fails."
4. A Narrow Pipe: Limited Spectrum and Carrier Configuration
The concept
Theoretical throughput scales with bandwidth. A 20 MHz LTE carrier carries roughly four times the capacity of a 5 MHz carrier under the same conditions.
Beyond a single carrier, there is Carrier Aggregation (CA), a feature that combines two or more carriers so the phone receives data across them at the same time. A site with CA across 1800 MHz and 800 MHz can deliver multiples of what a single 10 MHz carrier can.
Where it goes wrong
A site carries only one narrow carrier, often legacy spectrum.
CA is licensed or supported at the network but not enabled at that site, or the phone is not configured to use it.
MIMO (multiple antennas for parallel data streams) is limited to 2×2 where 4×4 would be possible, or is not active.
Re-farming of old 2G/3G spectrum to LTE is incomplete.
Takeaway: excellent coverage, thin capacity. The spectrum assignment directly affects the internet speed and network capacity experienced by mobile users, not just the number of signal bars displayed on their phones.
5. The Hidden Bottleneck: Backhaul and Transport
The concept
Backhaul is the connection between a mobile base station and the core network. It is typically provided through fiber-optic cables, microwave links or leased lines. It transports the combined data traffic generated by all users connected to that base station.
The bottleneck
Imagine upgrading an LTE site with 100 MHz of spectrum and advanced MIMO technology. The radio network may have enough capacity to deliver very high data rates. However, if the site is connected to the core network through a microwave link with only a few hundred Mbps of capacity, or a congested leased circuit, the users cannot benefit from the full radio capacity.
The limitation is no longer in the radio network; it is in the transport network. As traffic exceeds the available backhaul capacity, packets start accumulating in queues, latency increases, and data throughput becomes limited. Consequently, users experience slow internet even when their phones show strong signal strength and the radio network indicators look healthy.
How to recognize it
Throughput limitation: User throughput reaches a similar maximum level even when radio conditions are good and network traffic varies.
Healthy radio KPIs: RSRP, SINR and PRB utilization indicate that the radio network has sufficient capacity, yet users continue to experience slow internet.
Transport congestion: Packet loss, increased latency and link utilization spikes are observed on the backhaul or transport network.
Capacity mismatch: The available backhaul bandwidth is insufficient to carry the traffic that the radio network can potentially generate.
Takeaway: A mobile network is only as fast as its most restrictive link. Increasing radio capacity alone cannot guarantee better user experience. Radio access capacity, backhaul bandwidth and core network capacity must be dimensioned and upgraded together.
6. Camped on the Wrong Layer: Band and Technology Selection
The concept
Phones reselect cells based mostly on signal strength, often with priority rules the operator configures. Modern networks have multiple layers:
Low bands (e.g., 700/800/900 MHz): large coverage, good building penetration, narrow bandwidth, lower capacity.
Mid bands (e.g., 1800/2100/2600 MHz): balanced coverage and capacity.
High bands / C-band / mmWave: large bandwidth and high capacity, shorter range.
What goes wrong
A phone may stay on the low band with a strong signal and a nearly full cell, while a mid-band cell with slightly weaker signal and much more free capacity sits idle. Or the phone may fall back to 3G or 2G (for example, during a CS fallback for voice calls) and fail to return to LTE promptly.
Bars show strength, not which layer you're on. This is why idle-mode and connected-mode mobility parameters (reselection priorities, handover thresholds, load-balancing features) are among the most powerful optimization levers an operator has.
7. The Weak Side of the Link: Uplink Limitations
The concept
The tower transmits with tens of watts. A phone transmits with a fraction of a watt, from inside a pocket or a building. So the downlink (tower to phone) is almost always stronger than the uplink (phone to tower).
Why that slows downloads
Every download depends on uplink traffic: TCP acknowledgements (ACKs), channel quality reports, HARQ feedback (the "received correctly / please resend" messages) and scheduling requests. If the uplink is poor, these messages are delayed or lost, so the tower slows or retransmits downlink data.
Result: the phone hears a perfect downlink, but the network cannot hear the phone well. This is the classic uplink-limited cell edge or indoor scenario. High RSRP, slow speeds, and slow uploads, which is why photo and video uploads often feel worse than browsing.
8. When the Radio Is Innocent: Core, Transport and Content Issues
Sometimes the radio network is healthy and the problem lies beyond it:
Core network or UPF congestion: limited capacity in packet gateways.
Slow DNS resolution: the phone waits seconds before a website even starts loading.
Congested international gateway or peering links: especially significant where much content is hosted abroad.
Server-side slowness: the website or CDN is slow, not the network.
Policy and plan controls: fair-usage throttling, speed caps, data-saver modes, VPNs, or traffic shaping.
Phone-side factors: thermal throttling, old modem, background app updates, or a poor antenna in a case.
This is why serious diagnosis always tests end-to-end, from radio, through transport, through core, to the content.
9. A Practical Diagnostic Playbook
Observation | Most likely cause | What to check |
|---|---|---|
Fast at night, slow at evening peak | Congestion | PRB utilization, active users per cell |
High RSRP, low SINR/RSRQ | Interference, pilot pollution | Neighbor planning, tilt, PCI planning |
Constant speed ceiling at all hours | Backhaul or bandwidth limit | Transport utilization, carrier bandwidth |
Good download, poor upload | Uplink-limited | UL SINR, power headroom, cell edge |
Phone on 3G or low band despite LTE capacity | Mobility parameters | Reselection priorities, load balancing |
Radio KPIs healthy, users still slow | Core, DNS, international or server side | End-to-end tests, traceroutes |
For a field engineer or curious user: on Android, open the engineering or field-test menu (or use a cell-info app) and read RSRP, RSRQ, SINR, band, bandwidth and PCI, not only the bars. A strong RSRP with SINR below about 5 dB is an immediate red flag.
10. The Bigger Picture: Signal Bars Indicate Connectivity, Not Speed
The concept
Signal bars are designed to give users a simple indication of how strongly their phones are connected to a mobile network. They help answer one basic question: "Do I have a network connection?"
However, signal bars do not indicate the actual internet speed, available network capacity or quality of service. A phone displaying full signal bars does not guarantee a fast or reliable internet experience.
The reality
A user's actual internet experience depends on several interconnected network elements:
Radio Signal Quality → Spectrum Availability → Cell Capacity and Load → Backhaul and Transport → Core Network and Internet Connectivity → Server and Content Delivery
Each stage contributes to the overall performance. If any one of these elements becomes a bottleneck, the user's internet experience can deteriorate, even when the radio signal is strong.
In simple terms, the end-to-end user experience is constrained by the weakest link in the data delivery chain. Full signal bars only indicate that the phone has a strong radio connection; they do not guarantee that the rest of the network can deliver data efficiently.
The engineering perspective
When users complain, "My phone shows full signal, but my internet is slow," the response should not simply be, "Your signal is fine."
Instead, network engineers and operators should investigate:
Is the radio signal quality good?
Is sufficient spectrum bandwidth available?
Is the serving cell congested?
Does the backhaul have enough capacity?
Are the core network and internet gateways performing well?
Is the destination server delivering content efficiently?
Also, to maintain the required KPI, the operators should look beyond geographical coverage and signal availability. Network performance, data throughput, latency, reliability and actual user experience should also be considered when evaluating the quality of mobile services.
Lesson
Mobile connectivity is not just about reaching a signal; it is about delivering data efficiently from the network to the user's device.
Takeaway: Networks that measure and optimize end-to-end user experience, rather than focusing only on coverage and signal strength, are better positioned to earn customer trust.
Key Terms at a Glance
RSRP: reference signal power received; what the bars reflect.
RSRQ: signal quality relative to total received power and load.
SINR: useful signal versus interference plus noise; strongest predictor of speed.
CQI / MCS: the phone's channel report and the modulation/coding the tower picks in response.
PRB: the smallest schedulable slice of radio resource.
Carrier Aggregation (CA): combining carriers to widen the effective pipe.
MIMO: multiple antennas that send parallel data streams.
Backhaul: transport link between base station and core.
HARQ: fast retransmission feedback mechanism.
QoS / QoE: network-measured service quality versus user-perceived experience.
Disclaimer
The views and technical opinions expressed in this blog are my own and are presented from my perspective as a Communication Engineer. They are intended for technical discussion and knowledge sharing and should not be considered an official position, policy, or statement of any organization or institution with which I am affiliated.